I’m running Grafana Loki for my company now and I’ll never go back to anything else. Loki acts like grep, is blazing fast and low maintenance. If it sounds like magic it kind is.
I saw this post and genuinely thought one of my teammates wrote it.
I had to manage an ELK stack and it was a full time job when we were supposed to be focusing on other important SRE work.
Then we switched to Loki + Grafana and it’s been amazing. Loki is literally k8s wide grep by default but then has an amazing query language for filtering and transforming logs into tables or even doing Prometheus style queries on top of a log query which gives you a graph.
Managing Loki is super simple because it makes the trade off of not indexing anything other than the kubernetes labels, which are always going to be the same regardless of the app. And retention is just a breeze since all the data is stored in a bucket and not on the cluster.
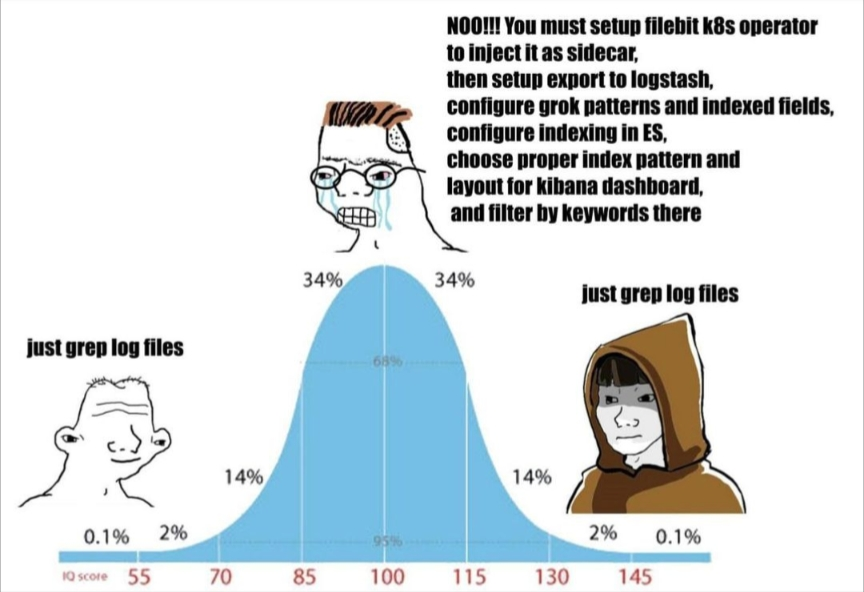
Sorry for gushing about Loki but I genuinely was that rage wojak before we switched. I am so much happier now.
We do Grafana + Prometheus for most of our clients but I think that adding Loki into the mix might be necessary. The amount of clients that are missing basic events like “you’ve run out of disk space…two days ago”, is too damn high.
I would add Alertmanager to your stack if you haven’t already. It’s pretty tightly integrated with prometheus. There’s some canned alerting rules based on predicting disk space full in X number of days. We wire Alertmanager to Pagerduty.
Sounds like you need an alert/monitoring system and not a logging system. Something like nagios where you immediately get an alert if something is past its limits, and where you don’t have to rely on logging.
Get DataDog if you can afford it. Shit magic. NewRelic is nice too, and cheaper. I used to use GreyLog and it was ok, Loki def was less work to maintain.
Datadog logs are basically in beta. You can send them synthetics apm and rum but I would be interested in spinning up my own private greylog instance to get away from DD logs
It’s released but it’s insane feature light, has massive injestion problems, requires massive collection overhead and doesn’t have a fraction of splunks indexing. And it’s using the standard dd UI and I personally dont like. Logs aren’t metrics, they need a different interface.
You are not logged in. However you can subscribe from another Fediverse account, for example Lemmy or Mastodon. To do this, paste the following into the search field of your instance: !programmerhumor@lemmy.ml
Post funny things about programming here! (Or just rant about your favourite programming language.)
Rules:
Posts must be relevant to programming, programmers, or computer science.
No NSFW content.
Jokes must be in good taste. No hate speech, bigotry, etc.


I’m running Grafana Loki for my company now and I’ll never go back to anything else. Loki acts like grep, is blazing fast and low maintenance. If it sounds like magic it kind is.
I saw this post and genuinely thought one of my teammates wrote it.
I had to manage an ELK stack and it was a full time job when we were supposed to be focusing on other important SRE work.
Then we switched to Loki + Grafana and it’s been amazing. Loki is literally k8s wide grep by default but then has an amazing query language for filtering and transforming logs into tables or even doing Prometheus style queries on top of a log query which gives you a graph.
Managing Loki is super simple because it makes the trade off of not indexing anything other than the kubernetes labels, which are always going to be the same regardless of the app. And retention is just a breeze since all the data is stored in a bucket and not on the cluster.
Sorry for gushing about Loki but I genuinely was that rage wojak before we switched. I am so much happier now.
We do Grafana + Prometheus for most of our clients but I think that adding Loki into the mix might be necessary. The amount of clients that are missing basic events like “you’ve run out of disk space…two days ago”, is too damn high.
I would add Alertmanager to your stack if you haven’t already. It’s pretty tightly integrated with prometheus. There’s some canned alerting rules based on predicting disk space full in X number of days. We wire Alertmanager to Pagerduty.
Sounds like you need an alert/monitoring system and not a logging system. Something like nagios where you immediately get an alert if something is past its limits, and where you don’t have to rely on logging.
Preaching to the choir. They hire use to performance tune their app but then their IT staff manges to not notice the most basic things.
For my personal servers, I use Netdata for this. Works pretty well.
Still don’t know how to offset my time on the graph but besides that I find just complicated enough but not too much
Get DataDog if you can afford it. Shit magic. NewRelic is nice too, and cheaper. I used to use GreyLog and it was ok, Loki def was less work to maintain.
Datadog logs are basically in beta. You can send them synthetics apm and rum but I would be interested in spinning up my own private greylog instance to get away from DD logs
I definitely don’t think they are in beta. What type of logs are you trying to get?
It’s released but it’s insane feature light, has massive injestion problems, requires massive collection overhead and doesn’t have a fraction of splunks indexing. And it’s using the standard dd UI and I personally dont like. Logs aren’t metrics, they need a different interface.